Звіт про доходи
Застосунок Odoo Events створює індивідуальні звіти на основі даних і аналітики, пов’язаних із заходами. Ці звіти можуть бути зосереджені на учасниках або доходах.
Наведена нижче документація зосереджена на параметрах звітності, пов’язаних із доходами від заходів.
Сторінка звітності про доходи
To access the Revenues reporting page, navigate to .
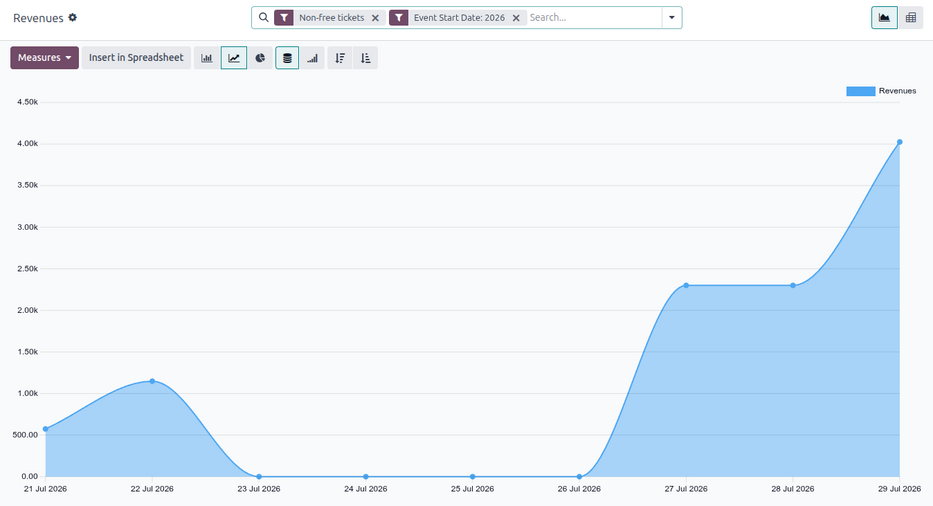
By default, the Revenues reporting page appears as a graph (a (Line Chart) with (Stacked) data). The default filters, Non-free tickets and Event Start Date: (current year), are applied in the search bar.
Порада
Щоб дізнатися більше про різні графічні представлення (і параметри графічного представлення), зверніться до документації Графічні представлення.
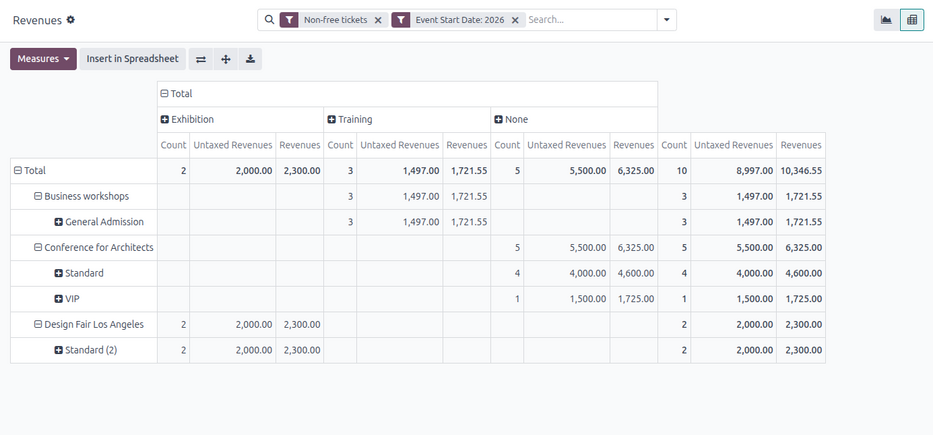
The Revenues reporting page can also be viewed as a pivot table, by clicking the (Pivot) icon in the upper-right corner.
Міри
Choosing specific measures allows users to customize reporting pages.
Clicking the Measures drop-down button reveals the following options:
Revenues: Shows the revenues generated from events.
Untaxed Revenues: Shows the untaxed revenues generated from events.
Count: Shows the total number of registrants who attended events.
Примітка
У графічному представленні можна вибрати лише один із показників одночасно.
Коли вибрано параметр зведеної таблиці, усі параметри Показників вибрано за замовчуванням.
Параметри фільтрів і групування
To reveal a drop-down menu of filter and grouping options, click the (down arrow) next to the search bar.
The drop-down menu allows users to set Filters and Group By options.
Примітка
Якщо в стовпці Фільтри вибрано параметр, пов’язаний із часом (наприклад, фільтр за замовчуванням Дата початку події: (рік)), з’являється стовпець Порівняння з параметрами порівняння для відповідного вибраного параметра фільтра, пов’язаного з часом.
Одночасно можна зробити лише один вибір зі стовпця Порівняння.
Параметри фільтрів
The Filters column in the search bar’s drop-down menu allows users to restrict the data to specific criteria.
Multiple options in the Filters column can be selected at once. Options can be applied to any view.
Стовпець Фільтри має такі параметри:
Non-free tickets: Filter by event tickets/registrations that are not free.
Free: Filter by event tickets/registrations that are free.
Pending payment: Filter by event tickets/registrations that are purchased but are pending payment.
Sold: Filter by event tickets/registrations that are sold and paid for.
Registration Date: Filter by a specific registration date. Click the (down arrow) icon to reveal a list of month, quarter, and year options.
Upcoming/Running: Filter by current or future events.
Past Events: Filter by completed events.
Event Start Date: Filter by a specific event start date. Click the (down arrow) icon to reveal a list of month, quarter, and year options.
Event End Date: Filter by a specific event end date. Click the (down arrow) icon to reveal a list of month, quarter, and year options.
Published Events: Filter by published events.
Add Custom Filter: Create a custom filter to analyze event-related revenue data.
Варіанти групування
The Group By column in the search bar’s drop-down menu allows users to group the data by specific criteria.
Можна одночасно вибрати кілька варіантів Групувати за.
Стовпець Групувати за має такі варіанти:
Тип події: групувати дані на основі типу події.
Подія: організувати дані в окремі групи, розділені за подіями.
Товар: групувати дані на основі товару реєстрації на подію.
Квиток: групувати дані на основі типу квитка на подію, придбаного учасниками.
Статус реєстрації: групувати дані на основі статусу реєстрацій.
Статус замовлення: групувати дані на основі статусу замовлень, пов’язаних з подіями.
Клієнт: Групування даних на основі записів клієнтів.
Add Custom Group: Create a custom group to organize data by additional fields. Click the (down arrow) icon to reveal a drop-down of grouping options. Multiple selections can be made.
Зразок звіту: аналіз квитків на події (графік)
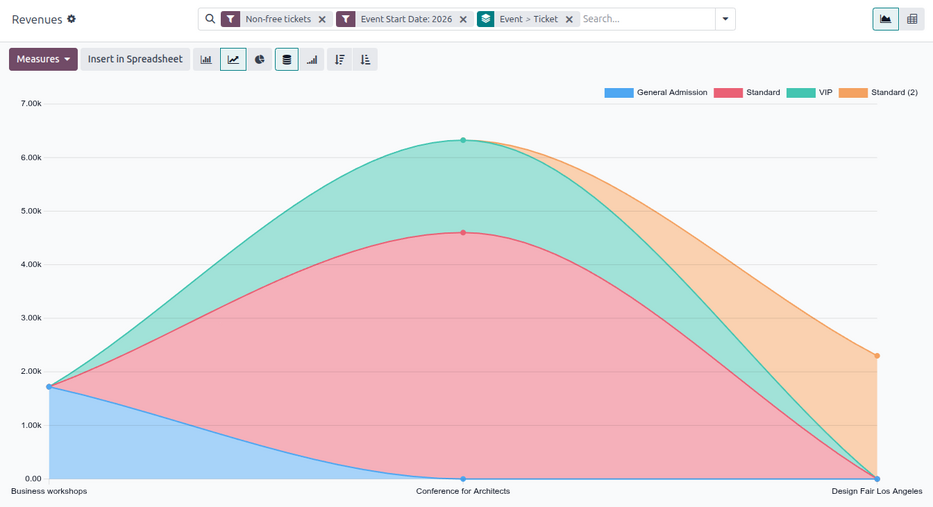
The following is an example of how various filters and grouping options can be used to compare the distributions of paid tickets and free tickets for published events, organized by ticket type and event.
To create this report, navigate to . Stay in the default graph view but remove the default filters from the search bar.
Then, click the (down arrow) next to the search bar. From here, select Free and Sold from the Filters column.
To view data related only to already published events, select the Published Events option in the Filters column.
Next, in the Group By column, select the Event and Ticket options, in that order. Doing so first groups the data by event, then by ticket type.
Важливо
The order in which the options are selected in the Group By column directly affects how the data is grouped and displayed on the report.
Зразок звіту: аналіз типів подій (зведена таблиця)
The following is an example of how to create a report analyzing revenue by event type to determine which event types are most profitable.
First, navigate to and switch to the pivot table view by clicking the (Pivot) icon in the upper-right corner.
Залишіть стандартні фільтри (Платні квитки та Дата початку події: (рік)) у рядку пошуку.
Next, open the Measures drop-down menu and deselect the option for Count as this report focuses only on revenues.
Потім клацніть на Усього над заголовками колонок і виберіть Тип події зі спадного меню, що з’явиться.
With these configurations, all revenues generated from the events and their corresponding registrations are organized by the event type.